Introduction — Standard widgets and history
The following widgets are included in the standard scope of delivery and are available to all users without the need to purchase additional apps.
-
Flat widgets are the various tiles that display data in the simple, first view.
-
Further details can be called up by clicking on a flat widget (Advanced view).
-
Certain settings can be made with installer rights.
Overview — Live view & history

-
In the live view of the FENECON Online Monitoring you will see pre-installed standard widgets.
-
With the exception of the Energy Monitor and the Announcement widget, each of the standard widgets has an advanced view.
-
Click on the text to find out more about the respective widget:
1. Energy Monitor
1.1. Energy Monitor — Live view
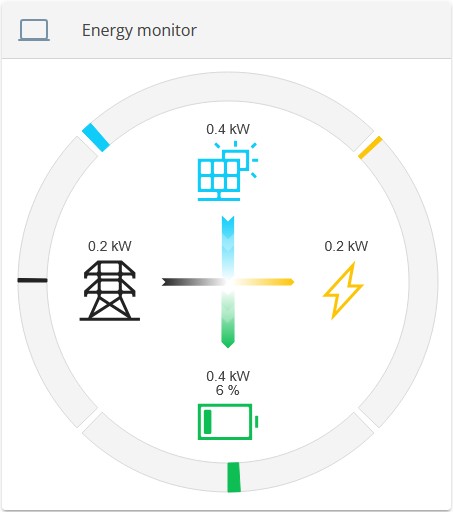
The Energy Monitor visualizes the energy flows in the system.
-
It shows the current production, consumption, charging and discharging of the battery as well as the current grid withdrawal or grid feed-in.
-
The gray bars represent the maximum possible power of the various elements, which is generated automatically.
-
The consumption is calculated.
-
If one of the elements (except consumption) does not exist in the system, it is hidden.
| This widget is for information purposes only and is not clickable. |
1.2. Energy Monitor — History
Clicking/tapping on the History tab takes you to the historical view of the Energy Monitor.

The widget shows a diagram with the production, consumption, grid and storage values at different points in time or during a period.
-
This can be selected above the Energy Monitor. This period selection then applies to all content in the history view.
-
The respective graph can be shown or hidden by clicking/tapping on the legend.
-
-
Below this are the standard widgets, which also have a historical view.
| Optionally acquired FEMS Apps can also have a historical view, e. g. the FEMS App Time-of-Use Tariff. |
-
A specific tag can be selected for viewing in the center of the top edge of the screen.
-
The data for the selected day can be downloaded as an Excel file in the Energy Monitor window on the right (REPORT).
-
2. Autarky
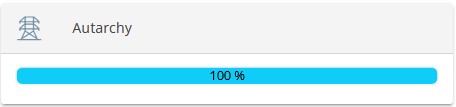
Autarky — Live view |
|
|---|---|
Flat widget for self-sufficiency live view: |
|
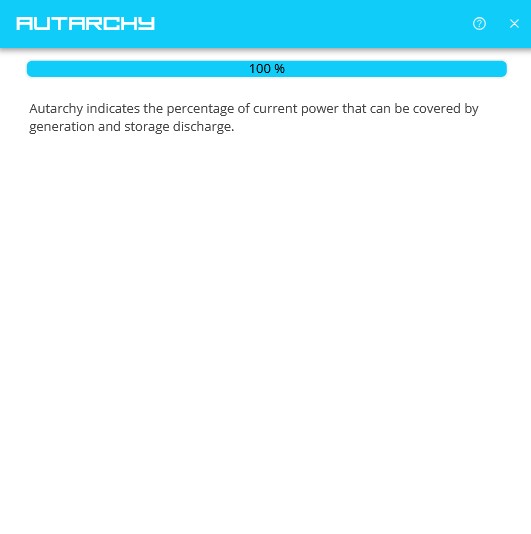
Clicking on the autarky live widget takes you to the expanded view with an explanation of the degree of autarky:
|
|
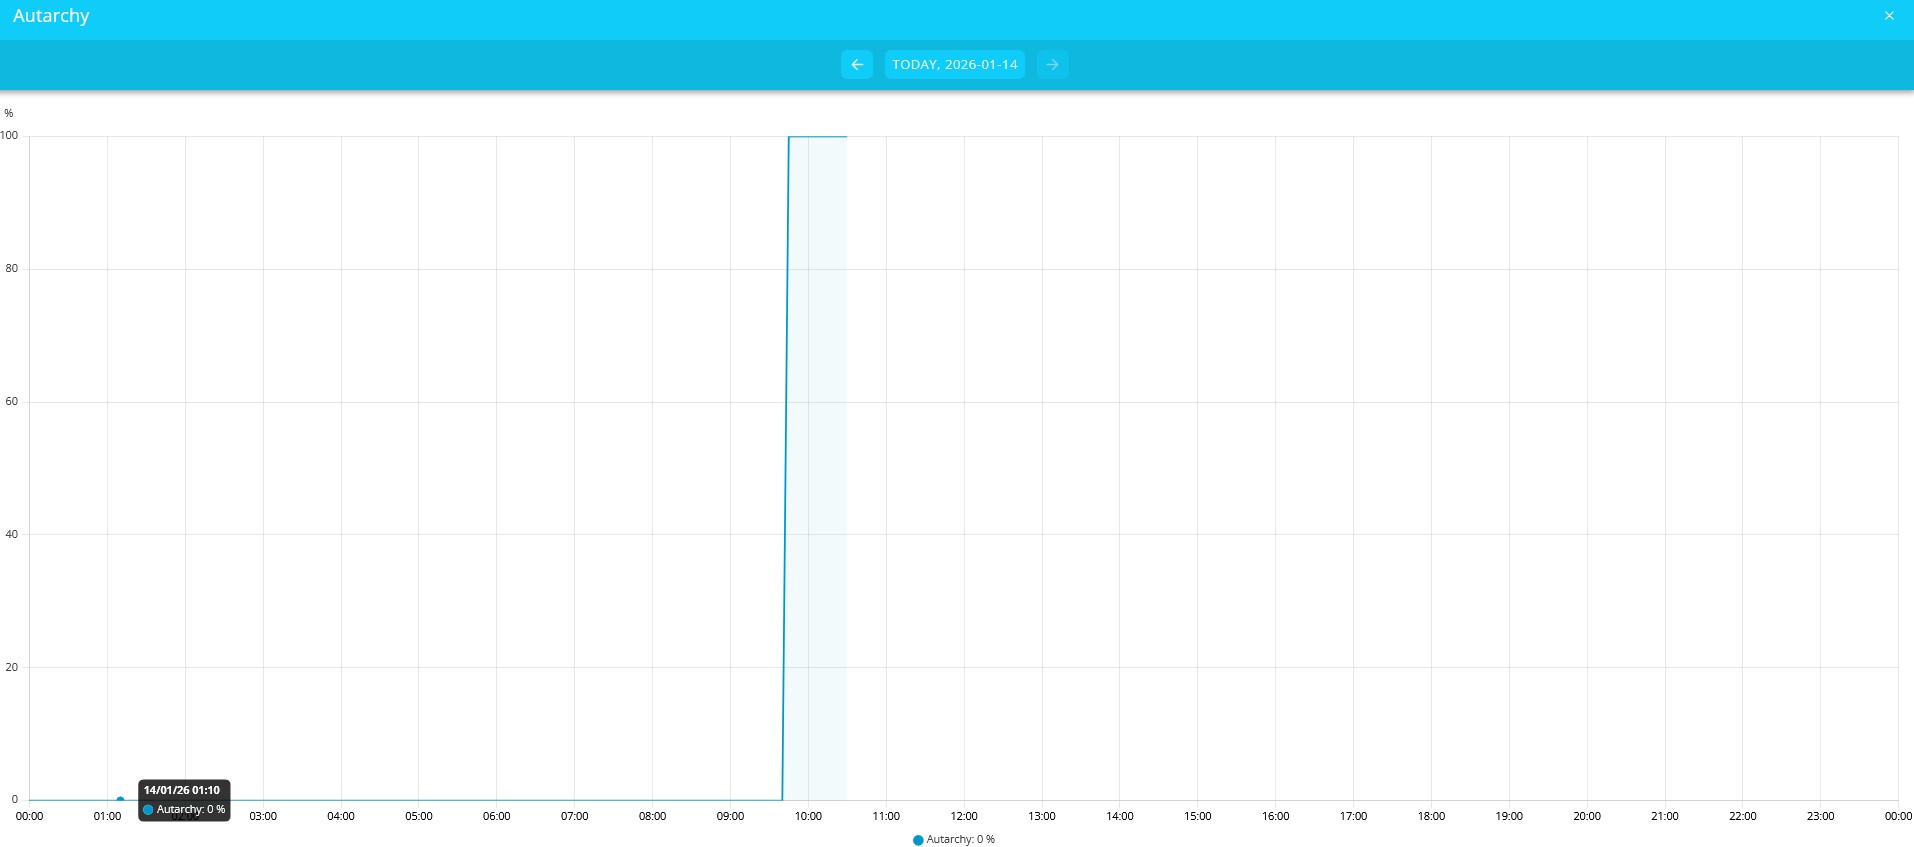
Autarky — History |
|
Flat widget for self-sufficiency history: |
|
Clicking on this widget takes you to the expanded view.
|
|
|
|
3. self-consumption
Self-consumption — Live view |
|
|---|---|
Flat widget for Self-consumption live view: |
|
Clicking on the Self-consumption live widget takes you to the expanded view. This explains Self-consumption:
|
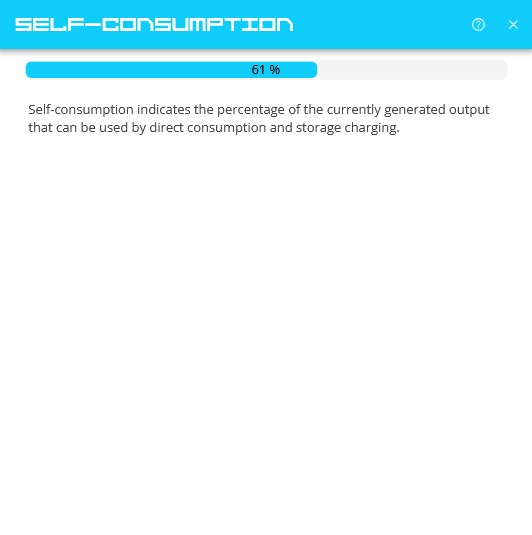
|
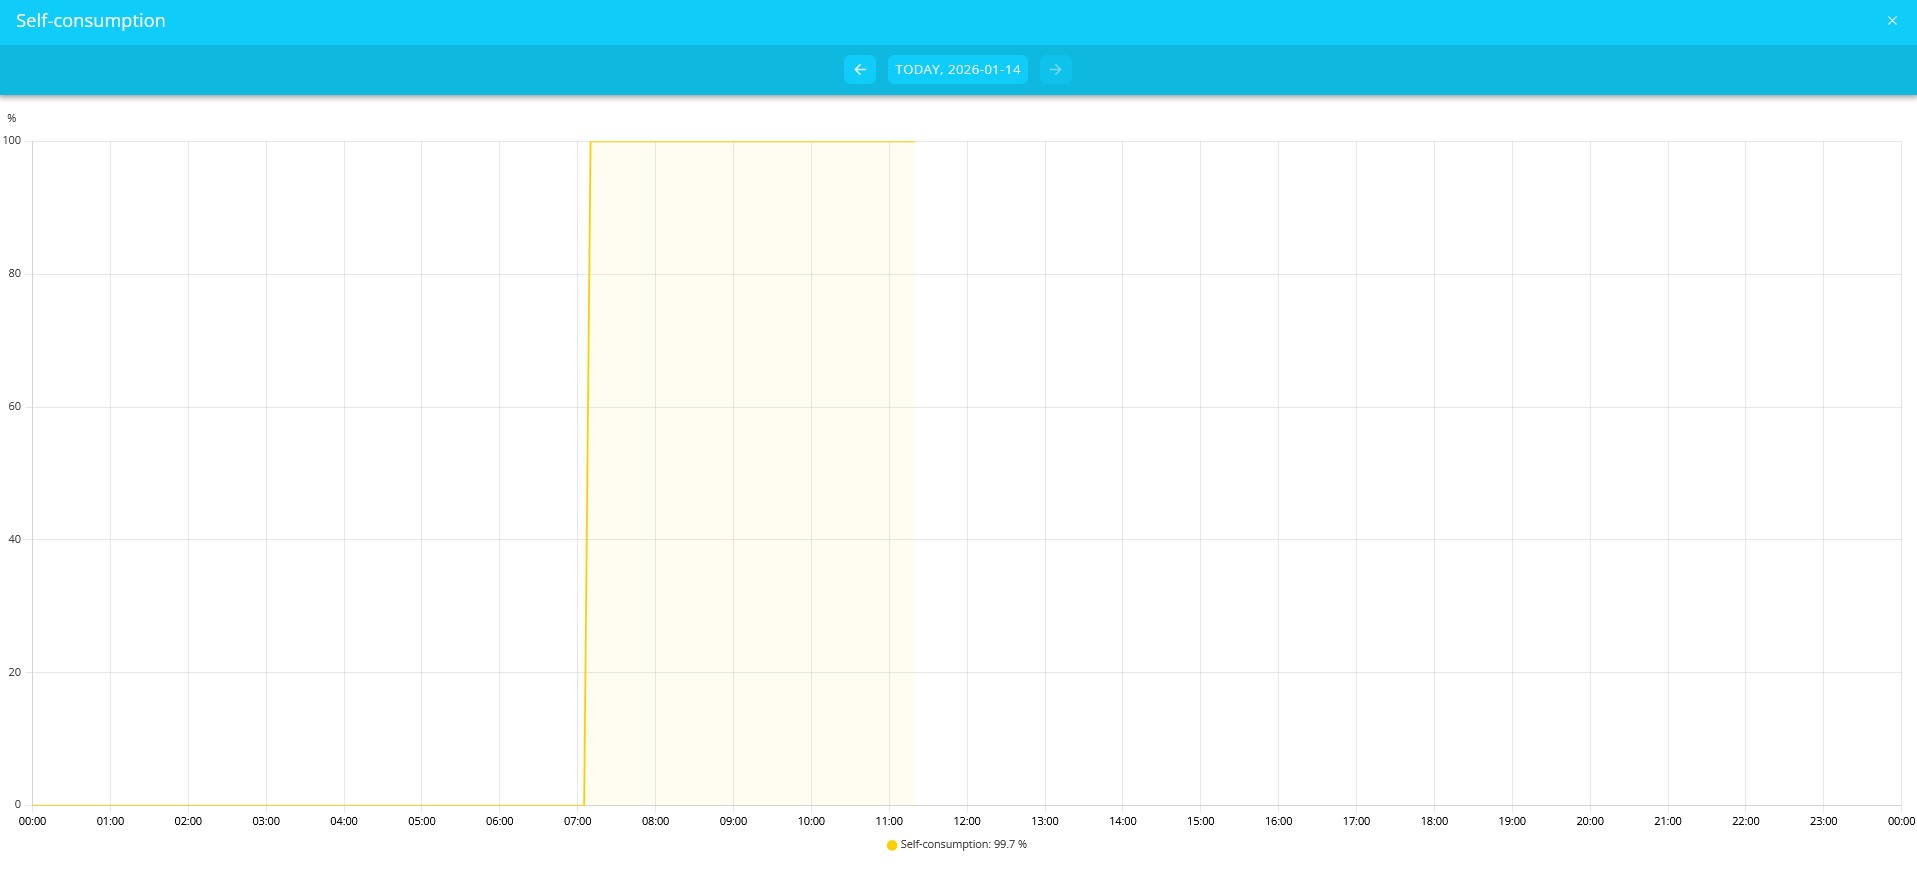
Self-consumption — History |
|
Flat widget for Self-consumption history: |
|
Clicking on this widget takes you to the extended view of the history.
|
|
|
|
TIP: Hat es keine Produktion gegeben, kann es auch keinen Eigenverbrauch geben! Daher wird der Eigenverbrauch im Diagramm nur angezeigt, wenn zu dem Zeitpunkt auch eine Produktionsleistung angelegen hat. |
|
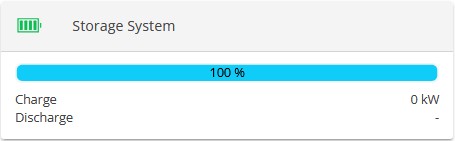
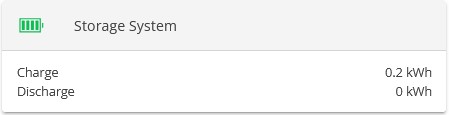
4. Electrical energy storage system
Electrical energy storage system — Live view |
|||
|---|---|---|---|
Flat widget for electrical energy storage system live view: |
|
||
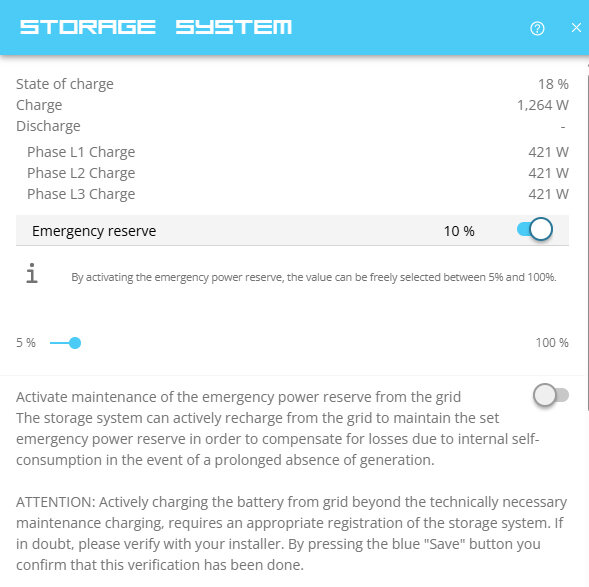
Clicking on this widget takes you to the expanded view of the electrical energy storage system live widget.
|
|
||
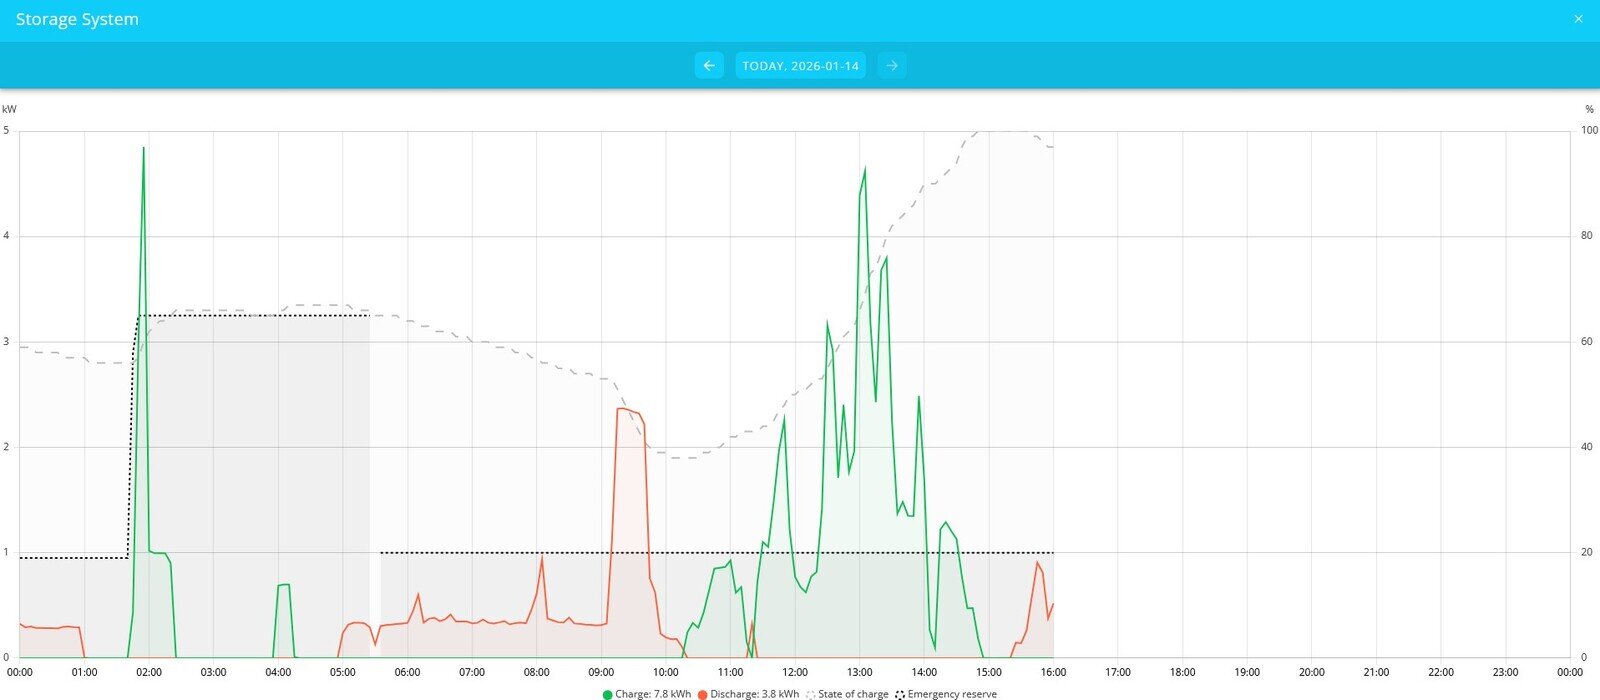
Electrical energy storage system — History |
|||
Flat widget for the electrical energy storage system history: |
|
||
Clicking on this widget will take you to the expanded view.
|
|||
|
|||
|
|||
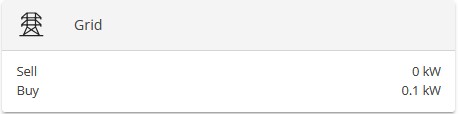
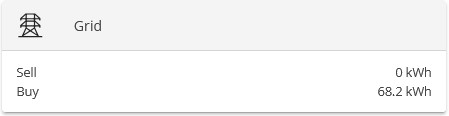
5. Grid
Grid — live view |
|
|---|---|
Flat widget for grid live view: |
|
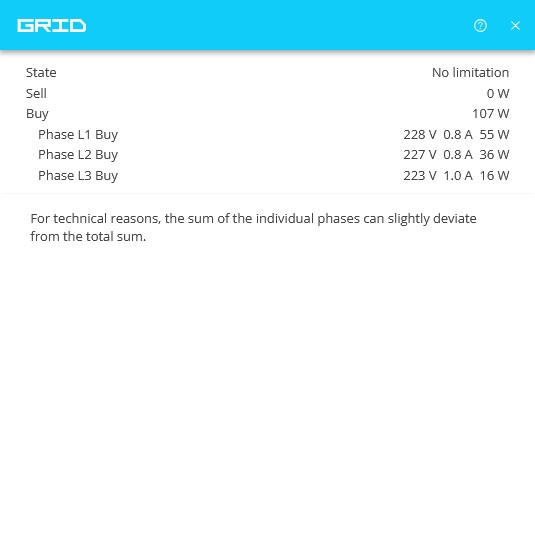
Clicking on this widget takes you to the expanded view of the grid live widget.
|
|
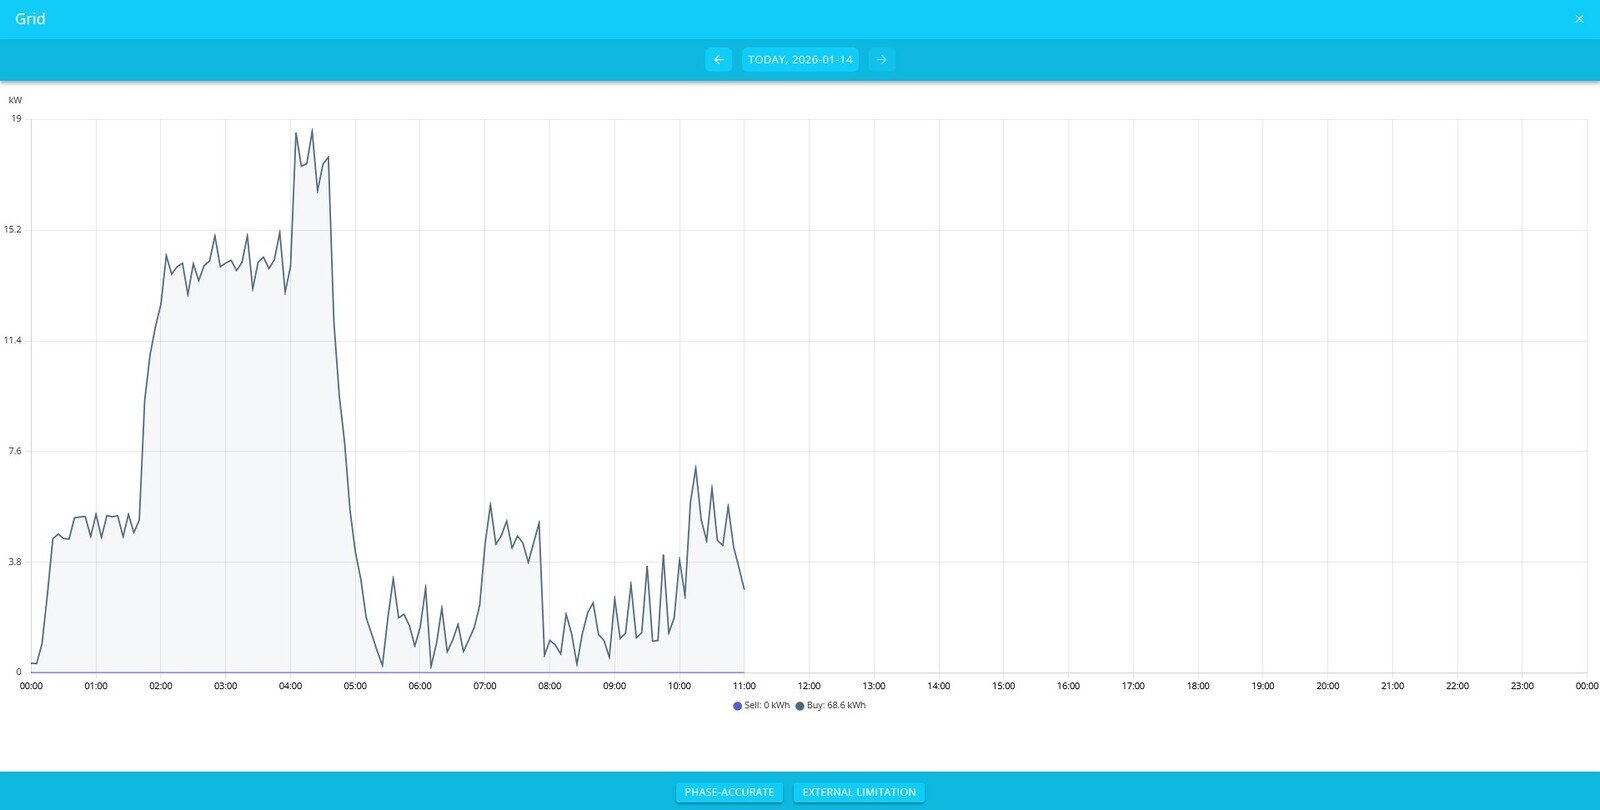
Grid — History |
|
Flat widget for grid history: |
|
Clicking on the grid history widget takes you to the expanded view of the grid history. Clicking on the grid history widget takes you to the expanded view of the grid history.
|
|
|
|
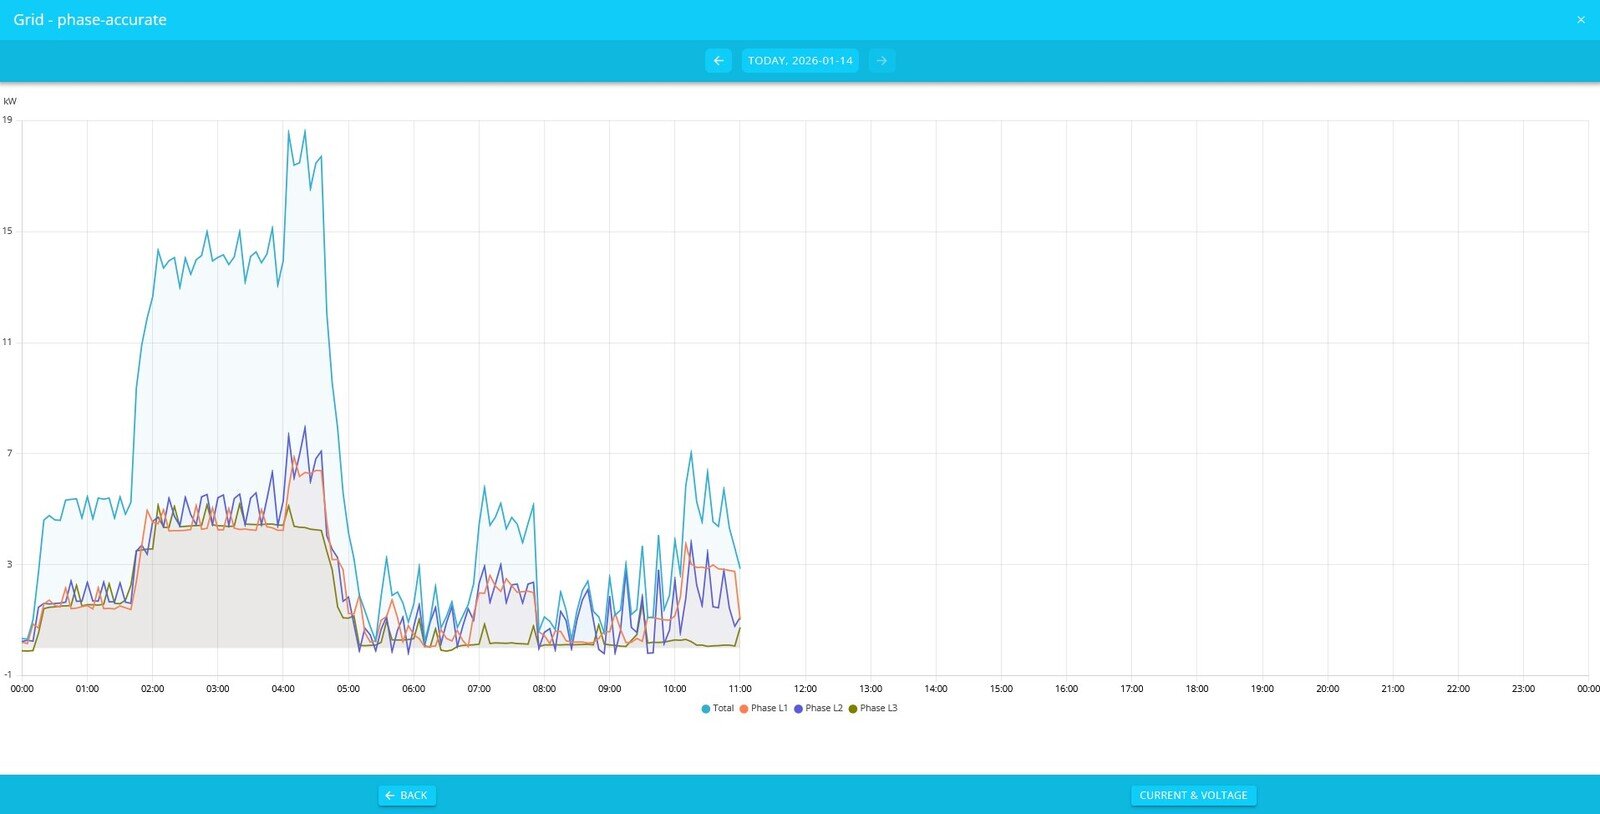
The phase values can also be displayed using the "Phase accurate" button. |
|
|
|
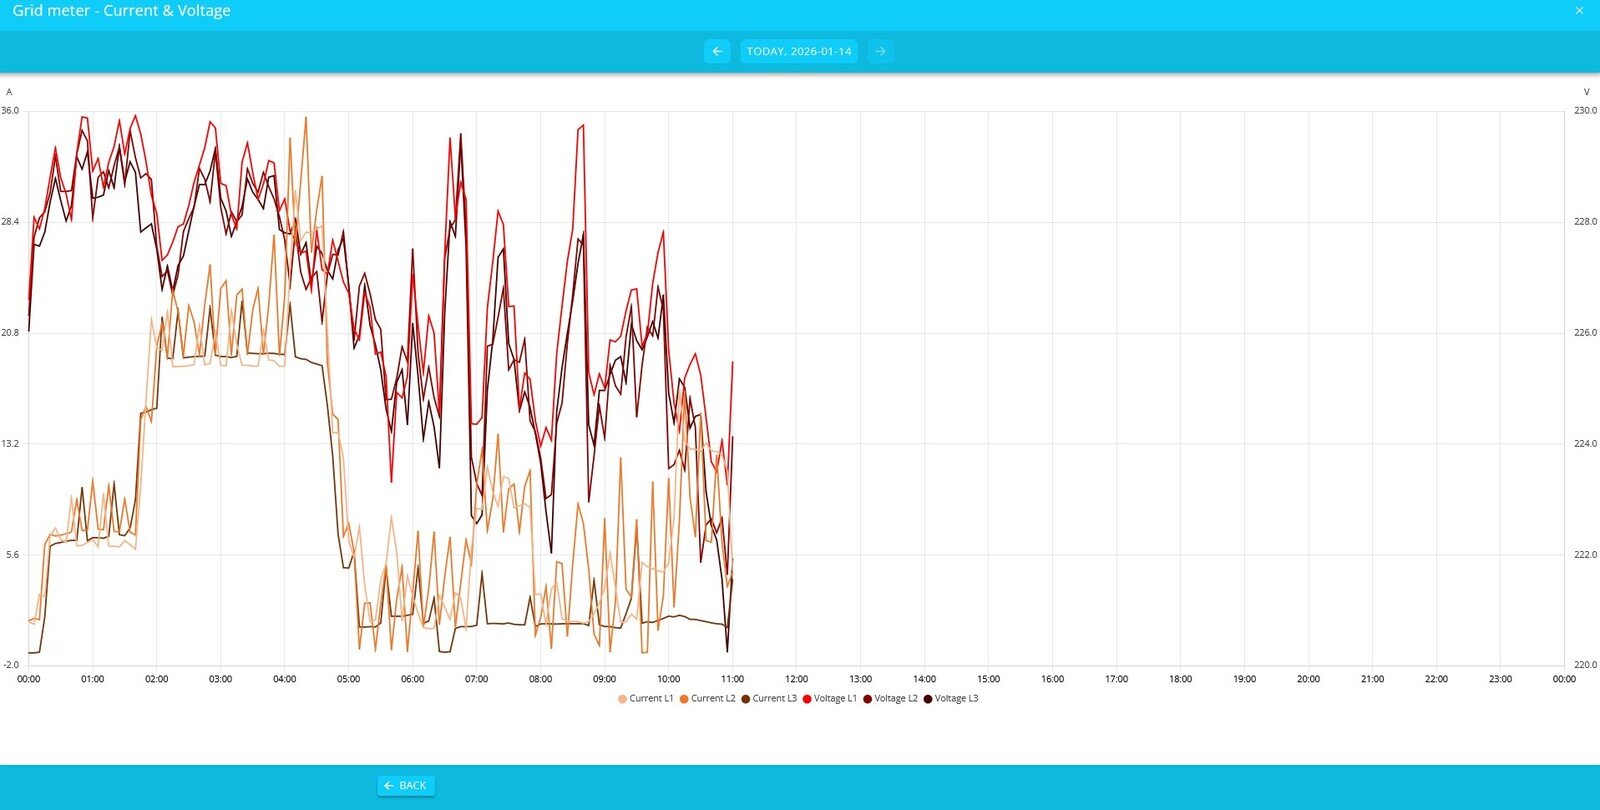
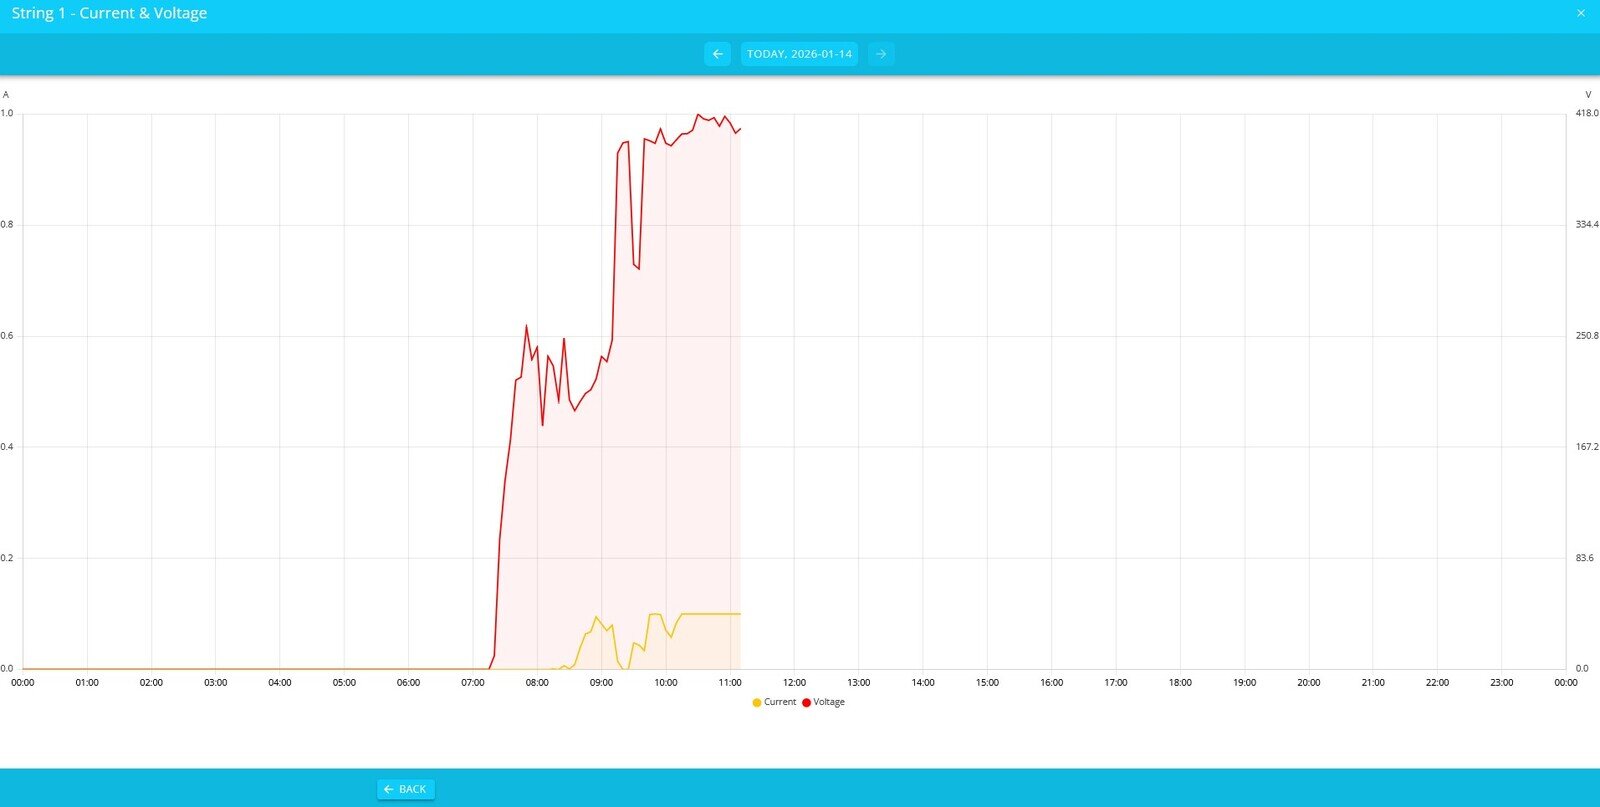
From this view, you can also display the current and voltage values with phase accuracy. |
|
|
|
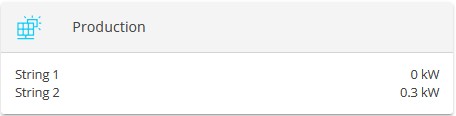
6. Production
Production — Live view |
|
|---|---|
Flat widget for Production live view: |
|
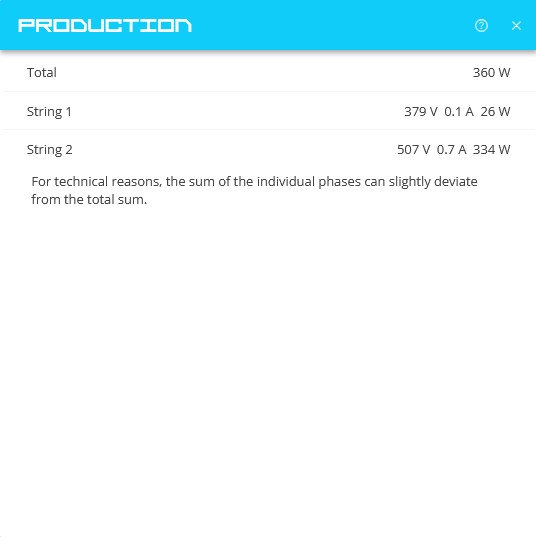
Clicking on this widget takes you to the expanded view of the Production live widget.
|
|
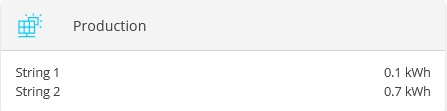
Production — History |
|
Flat widget for Production history: |
|
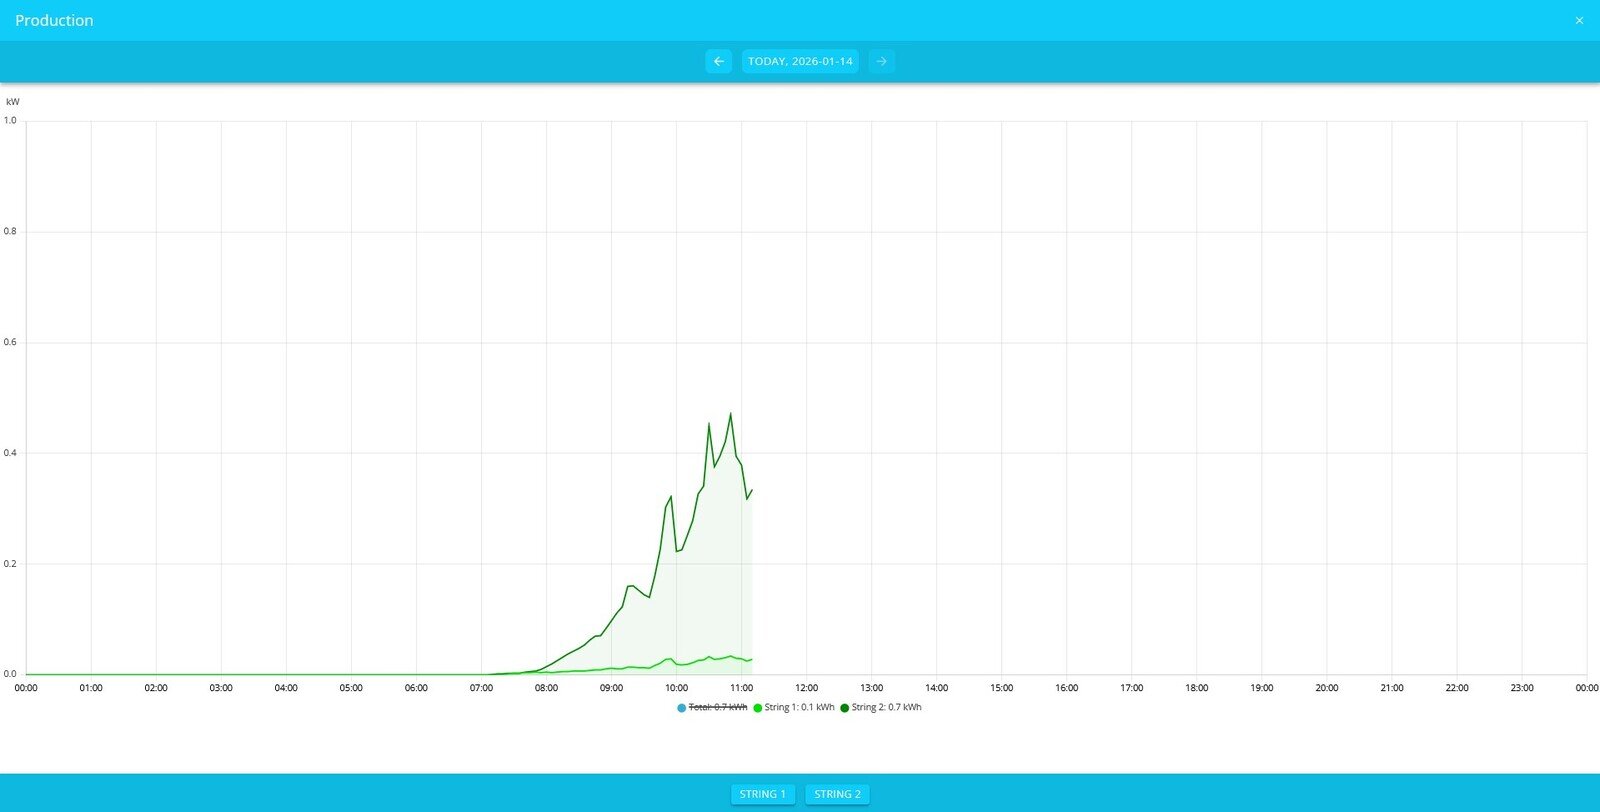
Historical view with multiple production meters: |
|
|
|
Using the button at the bottom center of the footer toolbar, the phase values of the respective production meters can be displayed and an overall diagram of the production can be created. |
|
|
|
|
From this view, you can also display the current and voltage values of the Production with phase accuracy. |
|
|
|
7. Consumption
Consumption — Live view |
|
|---|---|
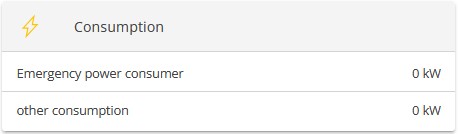
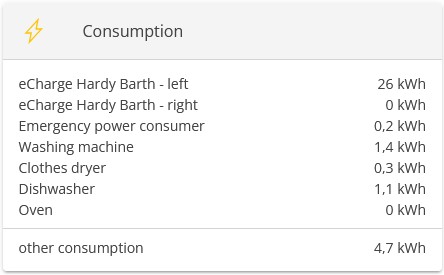
Flat widget for consumption live view: |
|
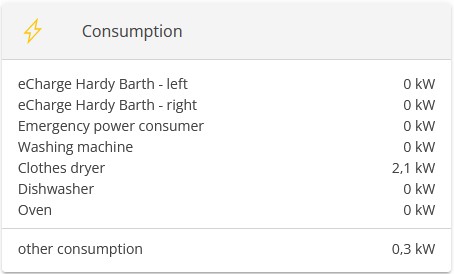
If other consumer loads (such as a charging station) are implemented, these are also displayed when consumption is active. |
|
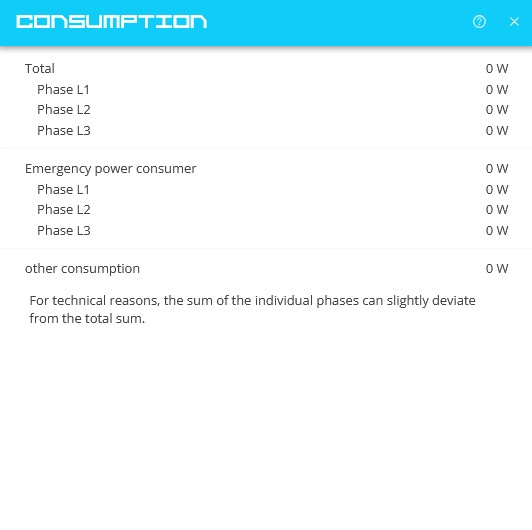
Clicking on this widget takes you to the expanded view of the consumption live widget.
|
|
View with multiple consumer loads: |
|
Consumption — History |
|
Flat widget for consumption history: |
|
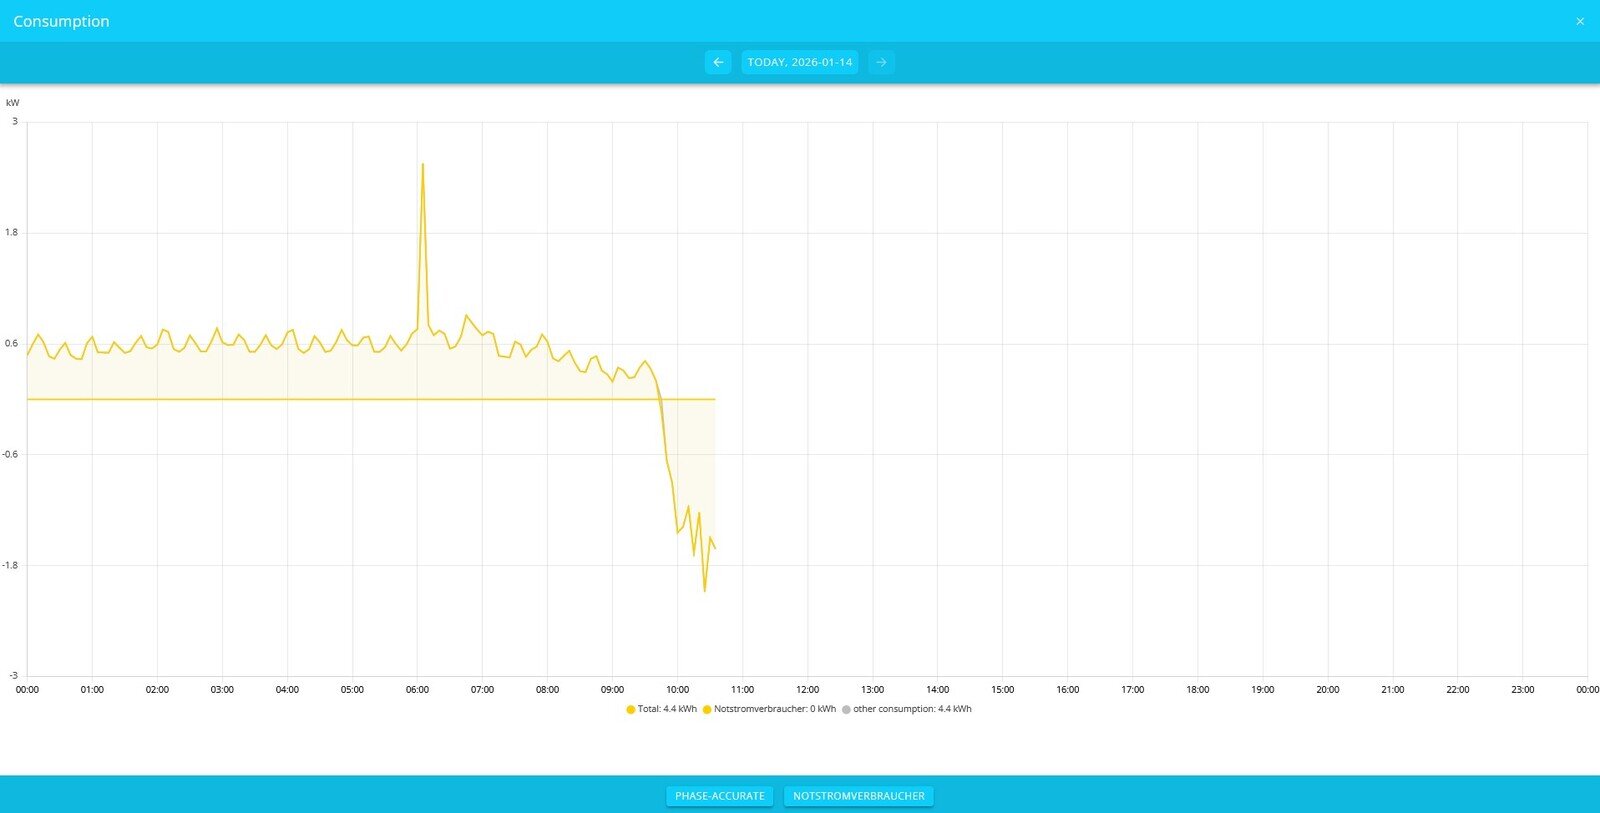
Clicking on the consumption history widget takes you to the expanded view.
|
|
|
|
View with multiple consumer loads: |
|

|
|
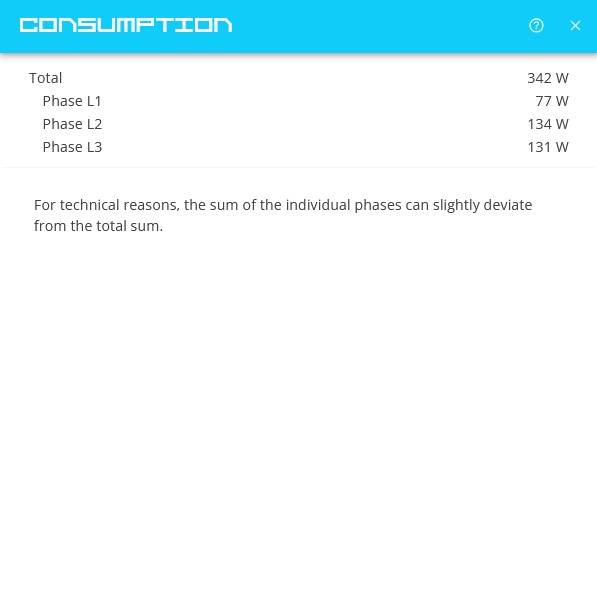
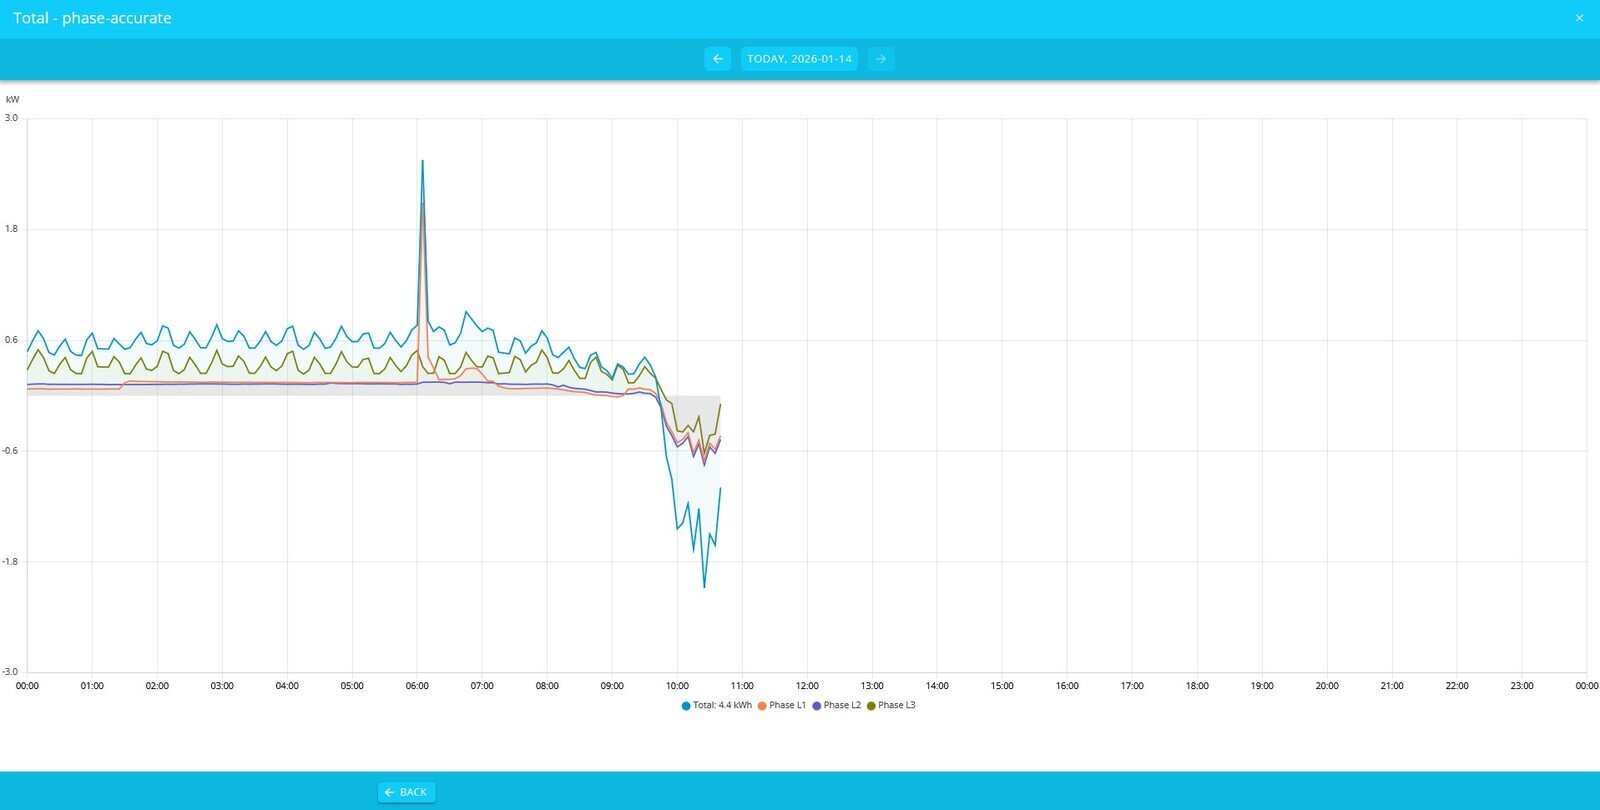
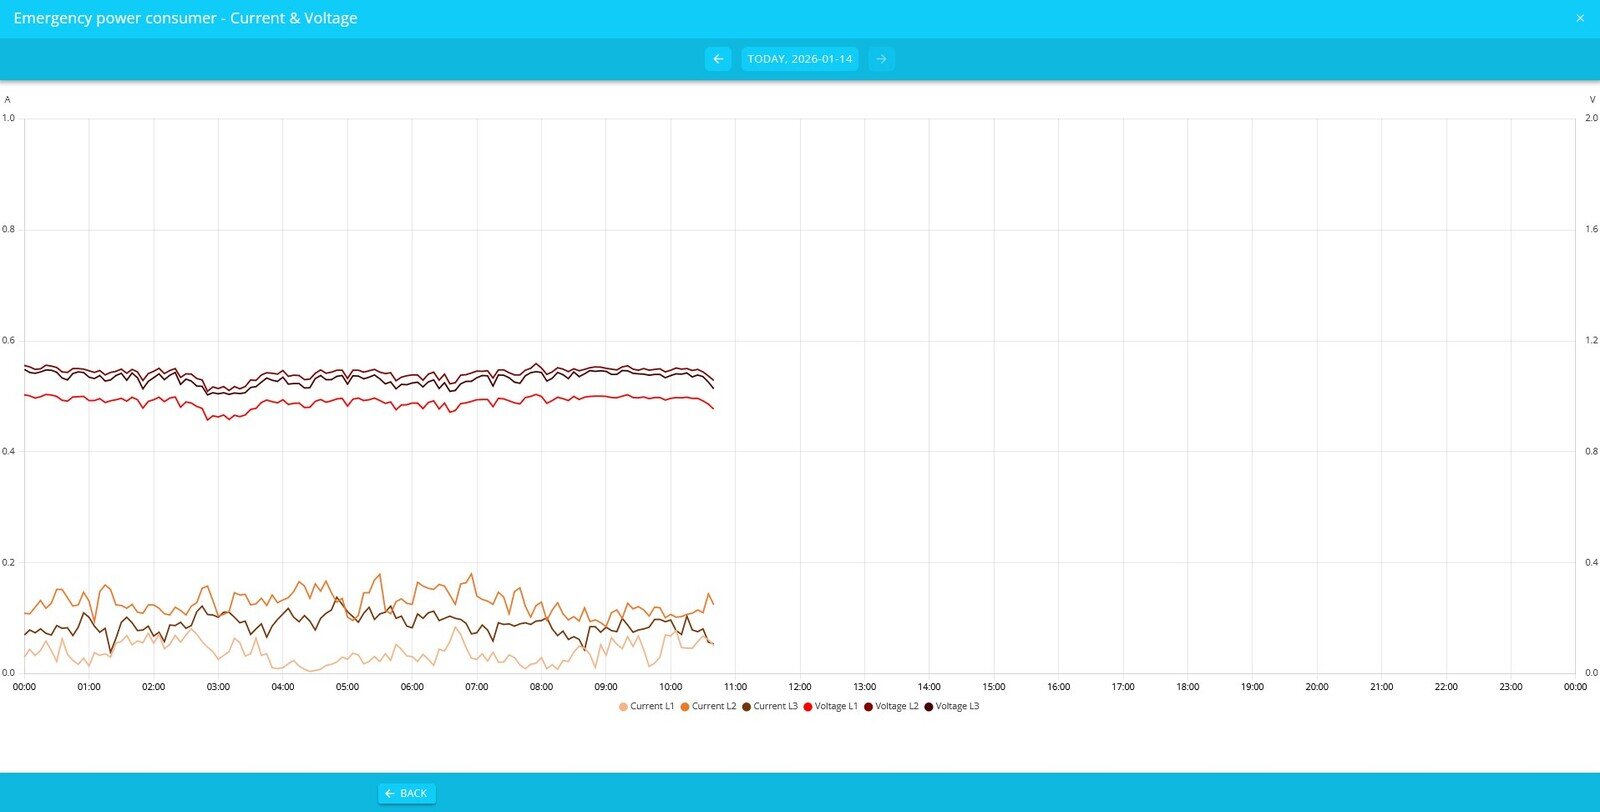
Using the buttons at the bottom center, the respective consumer loads can be selected and displayed in phase. |
|
|
|
Using the button at the bottom right, the current and voltage can also be displayed with phase accuracy. |
|
|
|